Эдуард Русланович
smartctl 7.2 2020-12-30 r5155 [x86_64-linux-5.16.0-5mx-amd64] (local build)
Copyright (C) 2002-20, Bruce Allen, Christian Franke, www.smartmontools.org
=== START OF INFORMATION SECTION ===
Model Family: Western Digital AV-GP (AF)
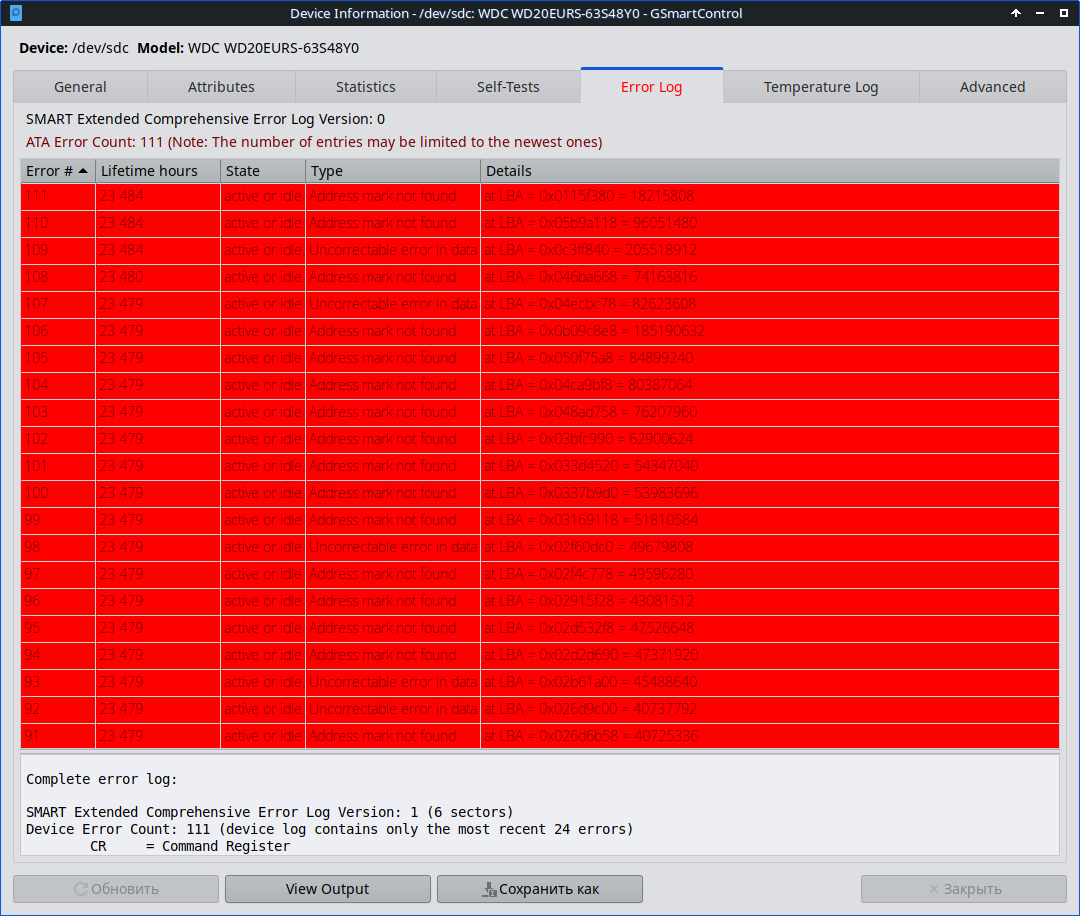
Device Model: WDC WD20EURS-63S48Y0
Serial Number: WD-WCAZA9991810
LU WWN Device Id: 5 0014ee 2b0ede379
Firmware Version: 51.0AB51
User Capacity: 2,000,398,934,016 bytes [2.00 TB]
Sector Sizes: 512 bytes logical, 4096 bytes physical
Device is: In smartctl database [for details use: -P show]
ATA Version is: ATA8-ACS (minor revision not indicated)
SATA Version is: SATA 2.6, 3.0 Gb/s
Local Time is: Thu May 30 21:09:24 2024 MSK
SMART support is: Available — device has SMART capability.
SMART support is: Enabled
AAM level is: 128 (quiet), recommended: 128
APM feature is: Unavailable
Rd look-ahead is: Enabled
Write cache is: Enabled
DSN feature is: Unavailable
ATA Security is: Disabled, frozen [SEC2]
=== START OF READ SMART DATA SECTION ===
SMART overall-health self-assessment test result: PASSED
General SMART Values:
Offline data collection status: (0x00) Offline data collection activity
was never started.
Auto Offline Data Collection: Disabled.
Self-test execution status: ( 0) The previous self-test routine completed
without error or no self-test has ever
been run.
Total time to complete Offline
data collection: (35100) seconds.
Offline data collection
capabilities: (0x7b) SMART execute Offline immediate.
Auto Offline data collection on/off support.
Suspend Offline collection upon new
command.
Offline surface scan supported.
Self-test supported.
Conveyance Self-test supported.
Selective Self-test supported.
SMART capabilities: (0x0003) Saves SMART data before entering
power-saving mode.
Supports SMART auto save timer.
Error logging capability: (0x01) Error logging supported.
General Purpose Logging supported.
Short self-test routine
recommended polling time: ( 2) minutes.
Extended self-test routine
recommended polling time: ( 339) minutes.
Conveyance self-test routine
recommended polling time: ( 5) minutes.
SCT capabilities: (0x3035) SCT Status supported.
SCT Feature Control supported.
SCT Data Table supported.
SMART Attributes Data Structure revision number: 16
Vendor Specific SMART Attributes with Thresholds:
ID# ATTRIBUTE_NAME FLAGS VALUE WORST THRESH FAIL RAW_VALUE
1 Raw_Read_Error_Rate POSR-K 200 200 051 — 4
3 Spin_Up_Time POS—K 204 164 021 — 4800
4 Start_Stop_Count -O—CK 066 066 000 — 34657
5 Reallocated_Sector_Ct PO—CK 200 200 140 — 0
7 Seek_Error_Rate -OSR-K 200 200 000 — 0
9 Power_On_Hours -O—CK 001 001 000 — 89083
10 Spin_Retry_Count -O—CK 100 100 000 — 0
11 Calibration_Retry_Count -O—CK 100 100 000 — 0
12 Power_Cycle_Count -O—CK 100 100 000 — 434
192 Power-Off_Retract_Count -O—CK 200 200 000 — 319
193 Load_Cycle_Count -O—CK 189 189 000 — 34337
194 Temperature_Celsius -O—K 122 081 000 — 28
196 Reallocated_Event_Count -O—CK 200 200 000 — 0
197 Current_Pending_Sector -O—CK 200 200 000 — 0
198 Offline_Uncorrectable —-CK 100 253 000 — 0
199 UDMA_CRC_Error_Count -O—CK 200 200 000 — 0
200 Multi_Zone_Error_Rate —R— 100 253 000 — 0
||||||_ K auto-keep
|||||__ C event count
||||___ R error rate
|||____ S speed/performance
||_____ O updated online
|______ P prefailure warning
General Purpose Log Directory Version 1
SMART Log Directory Version 1 [multi-sector log support]
Address Access R/W Size Description
0x00 GPL,SL R/O 1 Log Directory
0x01 SL R/O 1 Summary SMART error log
0x02 SL R/O 5 Comprehensive SMART error log
0x03 GPL R/O 6 Ext. Comprehensive SMART error log
0x06 SL R/O 1 SMART self-test log
0x07 GPL R/O 1 Extended self-test log
0x09 SL R/W 1 Selective self-test log
0x10 GPL R/O 1 NCQ Command Error log
0x11 GPL R/O 1 SATA Phy Event Counters log
0x21 GPL R/O 1 Write stream error log
0x22 GPL R/O 1 Read stream error log
0x80-0x9f GPL,SL R/W 16 Host vendor specific log
0xa0-0xa7 GPL,SL VS 16 Device vendor specific log
0xa8-0xb7 GPL,SL VS 1 Device vendor specific log
0xbd GPL,SL VS 1 Device vendor specific log
0xc0 GPL,SL VS 1 Device vendor specific log
0xc1 GPL VS 93 Device vendor specific log
0xe0 GPL,SL R/W 1 SCT Command/Status
0xe1 GPL,SL R/W 1 SCT Data Transfer
SMART Extended Comprehensive Error Log Version: 1 (6 sectors)
Device Error Count: 111 (device log contains only the most recent 24 errors)
CR = Command Register
FEATR = Features Register
COUNT = Count (was: Sector Count) Register
LBA_48 = Upper bytes of LBA High/Mid/Low Registers ] ATA-8
LH = LBA High (was: Cylinder High) Register ] LBA
LM = LBA Mid (was: Cylinder Low) Register ] Register
LL = LBA Low (was: Sector Number) Register ]
DV = Device (was: Device/Head) Register
DC = Device Control Register
ER = Error register
ST = Status register
Powered_Up_Time is measured from power on, and printed as
DDd+hh:mm:SS.sss where DD=days, hh=hours, mm=minutes,
SS=sec, and sss=millisec. It «wraps» after 49.710 days.
Error 111 [14] occurred at disk power-on lifetime: 23484 hours (978 days + 12 hours)
When the command that caused the error occurred, the device was active or idle.
After command completion occurred, registers were:
ER — ST COUNT LBA_48 LH LM LL DV DC
— — — == — == == == — — — — —
01 — 51 00 00 00 00 01 15 f3 80 40 00 Error: AMNF at LBA = 0x0115f380 = 18215808
Commands leading to the command that caused the error were:
CR FEATR COUNT LBA_48 LH LM LL DV DC Powered_Up_Time Command/Feature_Name
— == — == — == == == — — — — — ————— ———————
60 02 00 00 60 00 00 01 15 f2 00 40 00 09:07:55.456 READ FPDMA QUEUED
60 02 00 00 58 00 00 01 15 f0 00 40 00 09:07:55.454 READ FPDMA QUEUED
60 02 00 00 50 00 00 01 15 ee 00 40 00 09:07:55.453 READ FPDMA QUEUED
60 02 00 00 48 00 00 01 15 ec 00 40 00 09:07:55.450 READ FPDMA QUEUED
60 02 00 00 40 00 00 01 15 ea 00 40 00 09:07:55.448 READ FPDMA QUEUED
Error 110 [13] occurred at disk power-on lifetime: 23484 hours (978 days + 12 hours)
When the command that caused the error occurred, the device was active or idle.
After command completion occurred, registers were:
ER — ST COUNT LBA_48 LH LM LL DV DC
— — — == — == == == — — — — —
01 — 51 00 00 00 00 05 b9 a1 18 40 00 Error: AMNF at LBA = 0x05b9a118 = 96051480
Commands leading to the command that caused the error were:
CR FEATR COUNT LBA_48 LH LM LL DV DC Powered_Up_Time Command/Feature_Name
— == — == — == == == — — — — — ————— ———————
60 02 00 00 40 00 00 05 b9 a0 00 40 00 09:07:27.477 READ FPDMA QUEUED
60 02 00 00 38 00 00 05 b9 9e 00 40 00 09:07:27.475 READ FPDMA QUEUED
60 02 00 00 30 00 00 05 b9 9c 00 40 00 09:07:27.474 READ FPDMA QUEUED
60 02 00 00 28 00 00 05 b9 9a 00 40 00 09:07:27.473 READ FPDMA QUEUED
60 02 00 00 20 00 00 05 b9 98 00 40 00 09:07:27.471 READ FPDMA QUEUED
Error 109 [12] occurred at disk power-on lifetime: 23484 hours (978 days + 12 hours)
When the command that caused the error occurred, the device was active or idle.
After command completion occurred, registers were:
ER — ST COUNT LBA_48 LH LM LL DV DC
— — — == — == == == — — — — —
40 — 51 00 00 00 00 0c 3f f8 40 40 00 Error: UNC at LBA = 0x0c3ff840 = 205518912
Commands leading to the command that caused the error were:
CR FEATR COUNT LBA_48 LH LM LL DV DC Powered_Up_Time Command/Feature_Name
— == — == — == == == — — — — — ————— ———————
60 02 00 00 18 00 00 0c 3f f8 00 40 00 08:58:51.047 READ FPDMA QUEUED
60 02 00 00 10 00 00 0c 3f f6 00 40 00 08:58:48.705 READ FPDMA QUEUED
60 02 00 00 08 00 00 0c 3f f4 00 40 00 08:58:48.703 READ FPDMA QUEUED
60 02 00 00 00 00 00 0c 3f f2 00 40 00 08:58:48.702 READ FPDMA QUEUED
60 02 00 00 f8 00 00 0c 3f f0 00 40 00 08:58:48.700 READ FPDMA QUEUED
Error 108 [11] occurred at disk power-on lifetime: 23480 hours (978 days + 8 hours)
When the command that caused the error occurred, the device was active or idle.
After command completion occurred, registers were:
ER — ST COUNT LBA_48 LH LM LL DV DC
— — — == — == == == — — — — —
01 — 51 00 00 00 00 04 6b a6 68 40 00 Error: AMNF at LBA = 0x046ba668 = 74163816
Commands leading to the command that caused the error were:
CR FEATR COUNT LBA_48 LH LM LL DV DC Powered_Up_Time Command/Feature_Name
— == — == — == == == — — — — — ————— ———————
60 02 00 00 08 00 00 04 6b a5 80 40 00 05:01:11.509 READ FPDMA QUEUED
60 02 00 00 00 00 00 04 6b a3 80 40 00 05:01:11.508 READ FPDMA QUEUED
60 02 00 00 f8 00 00 04 6b a1 80 40 00 05:01:11.504 READ FPDMA QUEUED
60 02 00 00 f0 00 00 04 6b 9f 80 40 00 05:01:11.503 READ FPDMA QUEUED
60 01 80 00 e8 00 00 04 6b 9e 00 40 00 05:01:11.472 READ FPDMA QUEUED
Error 107 [10] occurred at disk power-on lifetime: 23479 hours (978 days + 7 hours)
When the command that caused the error occurred, the device was active or idle.
After command completion occurred, registers were:
ER — ST COUNT LBA_48 LH LM LL DV DC
— — — == — == == == — — — — —
40 — 51 00 00 00 00 04 ec bc 78 40 00 Error: UNC at LBA = 0x04ecbc78 = 82623608
Commands leading to the command that caused the error were:
CR FEATR COUNT LBA_48 LH LM LL DV DC Powered_Up_Time Command/Feature_Name
— == — == — == == == — — — — — ————— ———————
60 02 00 00 d0 00 00 04 ec bc 00 40 00 03:50:12.241 READ FPDMA QUEUED
60 02 00 00 c8 00 00 04 ec ba 00 40 00 03:50:12.238 READ FPDMA QUEUED
60 02 00 00 c0 00 00 04 ec b8 00 40 00 03:50:12.236 READ FPDMA QUEUED
60 02 00 00 b8 00 00 04 ec b6 00 40 00 03:50:12.234 READ FPDMA QUEUED
60 02 00 00 b0 00 00 04 ec b4 00 40 00 03:50:12.232 READ FPDMA QUEUED
Error 106 [9] occurred at disk power-on lifetime: 23479 hours (978 days + 7 hours)
When the command that caused the error occurred, the device was active or idle.
After command completion occurred, registers were:
ER — ST COUNT LBA_48 LH LM LL DV DC
— — — == — == == == — — — — —
01 — 51 00 00 00 00 0b 09 c8 e8 40 00 Error: AMNF at LBA = 0x0b09c8e8 = 185190632
Commands leading to the command that caused the error were:
CR FEATR COUNT LBA_48 LH LM LL DV DC Powered_Up_Time Command/Feature_Name
— == — == — == == == — — — — — ————— ———————
60 02 00 00 b0 00 00 0b 09 c8 00 40 00 03:40:46.992 READ FPDMA QUEUED
60 02 00 00 a8 00 00 0b 09 c6 00 40 00 03:40:46.990 READ FPDMA QUEUED
60 02 00 00 a0 00 00 0b 09 c4 00 40 00 03:40:46.989 READ FPDMA QUEUED
60 02 00 00 98 00 00 0b 09 c2 00 40 00 03:40:46.987 READ FPDMA QUEUED
60 02 00 00 90 00 00 0b 09 c0 00 40 00 03:40:46.986 READ FPDMA QUEUED
Error 105 [8] occurred at disk power-on lifetime: 23479 hours (978 days + 7 hours)
When the command that caused the error occurred, the device was active or idle.
After command completion occurred, registers were:
ER — ST COUNT LBA_48 LH LM LL DV DC
— — — == — == == == — — — — —
01 — 51 00 00 00 00 05 0f 75 a8 40 00 Error: AMNF at LBA = 0x050f75a8 = 84899240
Commands leading to the command that caused the error were:
CR FEATR COUNT LBA_48 LH LM LL DV DC Powered_Up_Time Command/Feature_Name
— == — == — == == == — — — — — ————— ———————
60 02 00 00 00 00 00 05 0f 74 80 40 00 03:38:22.383 READ FPDMA QUEUED
60 02 00 00 f8 00 00 05 0f 72 80 40 00 03:38:22.382 READ FPDMA QUEUED
60 02 00 00 f0 00 00 05 0f 70 80 40 00 03:38:22.380 READ FPDMA QUEUED
60 02 00 00 e8 00 00 05 0f 6e 80 40 00 03:38:22.379 READ FPDMA QUEUED
60 02 00 00 e0 00 00 05 0f 6c 80 40 00 03:38:22.377 READ FPDMA QUEUED
Error 104 [7] occurred at disk power-on lifetime: 23479 hours (978 days + 7 hours)
When the command that caused the error occurred, the device was active or idle.
After command completion occurred, registers were:
ER — ST COUNT LBA_48 LH LM LL DV DC
— — — == — == == == — — — — —
01 — 51 00 00 00 00 04 ca 9b f8 40 00 Error: AMNF at LBA = 0x04ca9bf8 = 80387064
Commands leading to the command that caused the error were:
CR FEATR COUNT LBA_48 LH LM LL DV DC Powered_Up_Time Command/Feature_Name
— == — == — == == == — — — — — ————— ———————
60 02 00 00 10 00 00 04 ca 9a 80 40 00 03:37:57.017 READ FPDMA QUEUED
60 02 00 00 08 00 00 04 ca 98 80 40 00 03:37:57.015 READ FPDMA QUEUED
60 02 00 00 00 00 00 04 ca 96 80 40 00 03:37:57.013 READ FPDMA QUEUED
60 02 00 00 f8 00 00 04 ca 94 80 40 00 03:37:57.011 READ FPDMA QUEUED
60 02 00 00 f0 00 00 04 ca 92 80 40 00 03:37:57.008 READ FPDMA QUEUED
Error 103 [6] occurred at disk power-on lifetime: 23479 hours (978 days + 7 hours)
When the command that caused the error occurred, the device was active or idle.
After command completion occurred, registers were:
ER — ST COUNT LBA_48 LH LM LL DV DC
— — — == — == == == — — — — —
01 — 51 00 00 00 00 04 8a d7 58 40 00 Error: AMNF at LBA = 0x048ad758 = 76207960
Commands leading to the command that caused the error were:
CR FEATR COUNT LBA_48 LH LM LL DV DC Powered_Up_Time Command/Feature_Name
— == — == — == == == — — — — — ————— ———————
60 02 00 00 a8 00 00 04 8a d6 00 40 00 03:37:32.740 READ FPDMA QUEUED
60 02 00 00 a0 00 00 04 8a d4 00 40 00 03:37:32.738 READ FPDMA QUEUED
60 02 00 00 98 00 00 04 8a d2 00 40 00 03:37:32.735 READ FPDMA QUEUED
60 02 00 00 90 00 00 04 8a d0 00 40 00 03:37:32.734 READ FPDMA QUEUED
60 02 00 00 88 00 00 04 8a ce 00 40 00 03:37:32.732 READ FPDMA QUEUED
Error 102 [5] occurred at disk power-on lifetime: 23479 hours (978 days + 7 hours)
When the command that caused the error occurred, the device was active or idle.
After command completion occurred, registers were:
ER — ST COUNT LBA_48 LH LM LL DV DC
— — — == — == == == — — — — —
01 — 51 00 00 00 00 03 bf c9 90 40 00 Error: AMNF at LBA = 0x03bfc990 = 62900624
Commands leading to the command that caused the error were:
CR FEATR COUNT LBA_48 LH LM LL DV DC Powered_Up_Time Command/Feature_Name
— == — == — == == == — — — — — ————— ———————
60 02 00 00 a8 00 00 03 bf c8 80 40 00 03:36:21.526 READ FPDMA QUEUED
60 02 00 00 a0 00 00 03 bf c6 80 40 00 03:36:21.525 READ FPDMA QUEUED
60 02 00 00 98 00 00 03 bf c4 80 40 00 03:36:21.524 READ FPDMA QUEUED
60 02 00 00 90 00 00 03 bf c2 80 40 00 03:36:21.522 READ FPDMA QUEUED
60 02 00 00 88 00 00 03 bf c0 80 40 00 03:36:21.520 READ FPDMA QUEUED
Error 101 [4] occurred at disk power-on lifetime: 23479 hours (978 days + 7 hours)
When the command that caused the error occurred, the device was active or idle.
After command completion occurred, registers were:
ER — ST COUNT LBA_48 LH LM LL DV DC
— — — == — == == == — — — — —
01 — 51 00 00 00 00 03 3d 45 20 40 00 Error: AMNF at LBA = 0x033d4520 = 54347040
Commands leading to the command that caused the error were:
CR FEATR COUNT LBA_48 LH LM LL DV DC Powered_Up_Time Command/Feature_Name
— == — == — == == == — — — — — ————— ———————
60 02 00 00 50 00 00 03 3d 44 00 40 00 03:35:44.848 READ FPDMA QUEUED
60 02 00 00 48 00 00 03 3d 42 00 40 00 03:35:44.846 READ FPDMA QUEUED
60 02 00 00 40 00 00 03 3d 40 00 40 00 03:35:44.845 READ FPDMA QUEUED
60 02 00 00 38 00 00 03 3d 3e 00 40 00 03:35:44.842 READ FPDMA QUEUED
60 02 00 00 30 00 00 03 3d 3c 00 40 00 03:35:44.840 READ FPDMA QUEUED
Error 100 [3] occurred at disk power-on lifetime: 23479 hours (978 days + 7 hours)
When the command that caused the error occurred, the device was active or idle.
After command completion occurred, registers were:
ER — ST COUNT LBA_48 LH LM LL DV DC
— — — == — == == == — — — — —
01 — 51 00 00 00 00 03 37 b9 d0 40 00 Error: AMNF at LBA = 0x0337b9d0 = 53983696
Commands leading to the command that caused the error were:
CR FEATR COUNT LBA_48 LH LM LL DV DC Powered_Up_Time Command/Feature_Name
— == — == — == == == — — — — — ————— ———————
60 02 00 00 50 00 00 03 37 b8 00 40 00 03:35:37.428 READ FPDMA QUEUED
60 02 00 00 48 00 00 03 37 b6 00 40 00 03:35:37.425 READ FPDMA QUEUED
60 02 00 00 40 00 00 03 37 b4 00 40 00 03:35:37.423 READ FPDMA QUEUED
60 02 00 00 38 00 00 03 37 b2 00 40 00 03:35:37.421 READ FPDMA QUEUED
60 02 00 00 30 00 00 03 37 b0 00 40 00 03:35:37.420 READ FPDMA QUEUED
Error 99 [2] occurred at disk power-on lifetime: 23479 hours (978 days + 7 hours)
When the command that caused the error occurred, the device was active or idle.
After command completion occurred, registers were:
ER — ST COUNT LBA_48 LH LM LL DV DC
— — — == — == == == — — — — —
01 — 51 00 00 00 00 03 16 91 18 40 00 Error: AMNF at LBA = 0x03169118 = 51810584
Commands leading to the command that caused the error were:
CR FEATR COUNT LBA_48 LH LM LL DV DC Powered_Up_Time Command/Feature_Name
— == — == — == == == — — — — — ————— ———————
60 02 00 00 c0 00 00 03 16 91 00 40 00 03:35:15.788 READ FPDMA QUEUED
60 02 00 00 b8 00 00 03 16 8f 00 40 00 03:35:15.787 READ FPDMA QUEUED
60 02 00 00 b0 00 00 03 16 8d 00 40 00 03:35:15.786 READ FPDMA QUEUED
60 02 00 00 a8 00 00 03 16 8b 00 40 00 03:35:15.784 READ FPDMA QUEUED
60 02 00 00 a0 00 00 03 16 89 00 40 00 03:35:15.782 READ FPDMA QUEUED
Error 98 [1] occurred at disk power-on lifetime: 23479 hours (978 days + 7 hours)
When the command that caused the error occurred, the device was active or idle.
After command completion occurred, registers were:
ER — ST COUNT LBA_48 LH LM LL DV DC
— — — == — == == == — — — — —
40 — 51 00 00 00 00 02 f6 0d c0 40 00 Error: UNC at LBA = 0x02f60dc0 = 49679808
Commands leading to the command that caused the error were:
CR FEATR COUNT LBA_48 LH LM LL DV DC Powered_Up_Time Command/Feature_Name
— == — == — == == == — — — — — ————— ———————
60 02 00 00 10 00 00 02 f6 0d 80 40 00 03:35:06.667 READ FPDMA QUEUED
60 02 00 00 08 00 00 02 f6 0b 80 40 00 03:35:06.665 READ FPDMA QUEUED
60 02 00 00 00 00 00 02 f6 09 80 40 00 03:35:06.663 READ FPDMA QUEUED
60 02 00 00 f8 00 00 02 f6 07 80 40 00 03:35:06.660 READ FPDMA QUEUED
60 02 00 00 f0 00 00 02 f6 05 80 40 00 03:35:06.658 READ FPDMA QUEUED
Error 97 [0] occurred at disk power-on lifetime: 23479 hours (978 days + 7 hours)
When the command that caused the error occurred, the device was active or idle.
After command completion occurred, registers were:
ER — ST COUNT LBA_48 LH LM LL DV DC
— — — == — == == == — — — — —
01 — 51 00 00 00 00 02 f4 c7 78 40 00 Error: AMNF at LBA = 0x02f4c778 = 49596280
Commands leading to the command that caused the error were:
CR FEATR COUNT LBA_48 LH LM LL DV DC Powered_Up_Time Command/Feature_Name
— == — == — == == == — — — — — ————— ———————
60 02 00 00 e8 00 00 02 f4 c5 80 40 00 03:34:57.362 READ FPDMA QUEUED
60 02 00 00 e0 00 00 02 f4 c3 80 40 00 03:34:57.361 READ FPDMA QUEUED
60 02 00 00 d8 00 00 02 f4 c1 80 40 00 03:34:57.359 READ FPDMA QUEUED
60 02 00 00 d0 00 00 02 f4 bf 80 40 00 03:34:57.356 READ FPDMA QUEUED
60 02 00 00 c8 00 00 02 f4 bd 80 40 00 03:34:57.354 READ FPDMA QUEUED
Error 96 [23] occurred at disk power-on lifetime: 23479 hours (978 days + 7 hours)
When the command that caused the error occurred, the device was active or idle.
After command completion occurred, registers were:
ER — ST COUNT LBA_48 LH LM LL DV DC
— — — == — == == == — — — — —
01 — 51 00 00 00 00 02 91 5f 28 40 00 Error: AMNF at LBA = 0x02915f28 = 43081512
Commands leading to the command that caused the error were:
CR FEATR COUNT LBA_48 LH LM LL DV DC Powered_Up_Time Command/Feature_Name
— == — == — == == == — — — — — ————— ———————
60 02 00 00 70 00 00 02 91 5d 80 40 00 03:34:44.632 READ FPDMA QUEUED
60 02 00 00 68 00 00 02 91 5b 80 40 00 03:34:44.629 READ FPDMA QUEUED
60 02 00 00 60 00 00 02 91 59 80 40 00 03:34:44.628 READ FPDMA QUEUED
60 02 00 00 58 00 00 02 91 57 80 40 00 03:34:44.626 READ FPDMA QUEUED
60 02 00 00 50 00 00 02 91 55 80 40 00 03:34:44.625 READ FPDMA QUEUED
Error 95 [22] occurred at disk power-on lifetime: 23479 hours (978 days + 7 hours)
When the command that caused the error occurred, the device was active or idle.
After command completion occurred, registers were:
ER — ST COUNT LBA_48 LH LM LL DV DC
— — — == — == == == — — — — —
01 — 51 00 00 00 00 02 d5 32 f8 40 00 Error: AMNF at LBA = 0x02d532f8 = 47526648
Commands leading to the command that caused the error were:
CR FEATR COUNT LBA_48 LH LM LL DV DC Powered_Up_Time Command/Feature_Name
— == — == — == == == — — — — — ————— ———————
60 02 00 00 48 00 00 02 d5 32 00 40 00 03:34:20.190 READ FPDMA QUEUED
60 02 00 00 40 00 00 02 d5 30 00 40 00 03:34:20.187 READ FPDMA QUEUED
60 02 00 00 38 00 00 02 d5 2e 00 40 00 03:34:20.186 READ FPDMA QUEUED
60 02 00 00 30 00 00 02 d5 2c 00 40 00 03:34:20.184 READ FPDMA QUEUED
60 02 00 00 28 00 00 02 d5 2a 00 40 00 03:34:20.181 READ FPDMA QUEUED
Error 94 [21] occurred at disk power-on lifetime: 23479 hours (978 days + 7 hours)
When the command that caused the error occurred, the device was active or idle.
After command completion occurred, registers were:
ER — ST COUNT LBA_48 LH LM LL DV DC
— — — == — == == == — — — — —
01 — 51 00 00 00 00 02 d2 d6 90 40 00 Error: AMNF at LBA = 0x02d2d690 = 47371920
Commands leading to the command that caused the error were:
CR FEATR COUNT LBA_48 LH LM LL DV DC Powered_Up_Time Command/Feature_Name
— == — == — == == == — — — — — ————— ———————
60 02 00 00 d0 00 00 02 d2 d6 00 40 00 03:34:12.507 READ FPDMA QUEUED
60 02 00 00 c8 00 00 02 d2 d4 00 40 00 03:34:12.506 READ FPDMA QUEUED
60 02 00 00 c0 00 00 02 d2 d2 00 40 00 03:34:12.504 READ FPDMA QUEUED
60 02 00 00 b8 00 00 02 d2 d0 00 40 00 03:34:12.502 READ FPDMA QUEUED
60 02 00 00 b0 00 00 02 d2 ce 00 40 00 03:34:12.500 READ FPDMA QUEUED
Error 93 [20] occurred at disk power-on lifetime: 23479 hours (978 days + 7 hours)
When the command that caused the error occurred, the device was active or idle.
After command completion occurred, registers were:
ER — ST COUNT LBA_48 LH LM LL DV DC
— — — == — == == == — — — — —
40 — 51 00 00 00 00 02 b6 1a 00 40 00 Error: UNC at LBA = 0x02b61a00 = 45488640
Commands leading to the command that caused the error were:
CR FEATR COUNT LBA_48 LH LM LL DV DC Powered_Up_Time Command/Feature_Name
— == — == — == == == — — — — — ————— ———————
60 02 00 00 f8 00 00 02 b6 1a 00 40 00 03:34:03.070 READ FPDMA QUEUED
60 02 00 00 f0 00 00 02 b6 18 00 40 00 03:34:03.068 READ FPDMA QUEUED
60 02 00 00 e8 00 00 02 b6 16 00 40 00 03:34:03.066 READ FPDMA QUEUED
60 02 00 00 e0 00 00 02 b6 14 00 40 00 03:34:03.064 READ FPDMA QUEUED
60 02 00 00 d8 00 00 02 b6 12 00 40 00 03:34:03.062 READ FPDMA QUEUED
Error 92 [19] occurred at disk power-on lifetime: 23479 hours (978 days + 7 hours)
When the command that caused the error occurred, the device was active or idle.
After command completion occurred, registers were:
ER — ST COUNT LBA_48 LH LM LL DV DC
— — — == — == == == — — — — —
40 — 51 00 00 00 00 02 6d 9c 00 40 00 Error: UNC at LBA = 0x026d9c00 = 40737792
Commands leading to the command that caused the error were:
CR FEATR COUNT LBA_48 LH LM LL DV DC Powered_Up_Time Command/Feature_Name
— == — == — == == == — — — — — ————— ———————
60 02 00 00 98 00 00 02 6d 9c 00 40 00 03:33:40.113 READ FPDMA QUEUED
60 02 00 00 90 00 00 02 6d 9a 00 40 00 03:33:40.110 READ FPDMA QUEUED
60 02 00 00 88 00 00 02 6d 98 00 40 00 03:33:40.109 READ FPDMA QUEUED
60 02 00 00 80 00 00 02 6d 96 00 40 00 03:33:40.106 READ FPDMA QUEUED
60 02 00 00 78 00 00 02 6d 94 00 40 00 03:33:40.104 READ FPDMA QUEUED
Error 91 [18] occurred at disk power-on lifetime: 23479 hours (978 days + 7 hours)
When the command that caused the error occurred, the device was active or idle.
After command completion occurred, registers were:
ER — ST COUNT LBA_48 LH LM LL DV DC
— — — == — == == == — — — — —
01 — 51 00 00 00 00 02 6d 6b 58 40 00 Error: AMNF at LBA = 0x026d6b58 = 40725336
Commands leading to the command that caused the error were:
CR FEATR COUNT LBA_48 LH LM LL DV DC Powered_Up_Time Command/Feature_Name
— == — == — == == == — — — — — ————— ———————
60 02 00 00 c8 00 00 02 6d 6a 00 40 00 03:33:31.540 READ FPDMA QUEUED
60 02 00 00 c0 00 00 02 6d 68 00 40 00 03:33:31.539 READ FPDMA QUEUED
60 02 00 00 b8 00 00 02 6d 66 00 40 00 03:33:31.537 READ FPDMA QUEUED
60 02 00 00 b0 00 00 02 6d 64 00 40 00 03:33:31.535 READ FPDMA QUEUED
60 02 00 00 a8 00 00 02 6d 62 00 40 00 03:33:31.533 READ FPDMA QUEUED
Error 90 [17] occurred at disk power-on lifetime: 23479 hours (978 days + 7 hours)
When the command that caused the error occurred, the device was active or idle.
After command completion occurred, registers were:
ER — ST COUNT LBA_48 LH LM LL DV DC
— — — == — == == == — — — — —
40 — 51 00 00 00 00 02 4b a2 10 40 00 Error: UNC at LBA = 0x024ba210 = 38511120
Commands leading to the command that caused the error were:
CR FEATR COUNT LBA_48 LH LM LL DV DC Powered_Up_Time Command/Feature_Name
— == — == — == == == — — — — — ————— ———————
60 02 00 00 18 00 00 02 4b a1 00 40 00 03:33:22.888 READ FPDMA QUEUED
60 02 00 00 10 00 00 02 4b 9f 00 40 00 03:33:22.887 READ FPDMA QUEUED
60 02 00 00 08 00 00 02 4b 9d 00 40 00 03:33:22.886 READ FPDMA QUEUED
60 02 00 00 00 00 00 02 4b 9b 00 40 00 03:33:22.884 READ FPDMA QUEUED
60 02 00 00 f8 00 00 02 4b 99 00 40 00 03:33:22.883 READ FPDMA QUEUED
Error 89 [16] occurred at disk power-on lifetime: 23479 hours (978 days + 7 hours)
When the command that caused the error occurred, the device was active or idle.
After command completion occurred, registers were:
ER — ST COUNT LBA_48 LH LM LL DV DC
— — — == — == == == — — — — —
01 — 51 00 00 00 00 02 2e a8 58 40 00 Error: AMNF at LBA = 0x022ea858 = 36612184
Commands leading to the command that caused the error were:
CR FEATR COUNT LBA_48 LH LM LL DV DC Powered_Up_Time Command/Feature_Name
— == — == — == == == — — — — — ————— ———————
60 02 00 00 78 00 00 02 2e a8 00 40 00 03:32:58.455 READ FPDMA QUEUED
60 02 00 00 70 00 00 02 2e a6 00 40 00 03:32:58.453 READ FPDMA QUEUED
60 02 00 00 68 00 00 02 2e a4 00 40 00 03:32:58.451 READ FPDMA QUEUED
60 02 00 00 60 00 00 02 2e a2 00 40 00 03:32:58.449 READ FPDMA QUEUED
60 02 00 00 58 00 00 02 2e a0 00 40 00 03:32:58.448 READ FPDMA QUEUED
Error 88 [15] occurred at disk power-on lifetime: 23479 hours (978 days + 7 hours)
When the command that caused the error occurred, the device was active or idle.
After command completion occurred, registers were:
ER — ST COUNT LBA_48 LH LM LL DV DC
— — — == — == == == — — — — —
40 — 51 00 00 00 00 01 c7 9a 00 40 00 Error: UNC at LBA = 0x01c79a00 = 29858304
Commands leading to the command that caused the error were:
CR FEATR COUNT LBA_48 LH LM LL DV DC Powered_Up_Time Command/Feature_Name
— == — == — == == == — — — — — ————— ———————
60 02 00 00 a8 00 00 01 c7 9a 00 40 00 03:32:42.714 READ FPDMA QUEUED
60 02 00 00 a0 00 00 01 c7 98 00 40 00 03:32:42.713 READ FPDMA QUEUED
60 02 00 00 98 00 00 01 c7 96 00 40 00 03:32:42.711 READ FPDMA QUEUED
60 02 00 00 90 00 00 01 c7 94 00 40 00 03:32:42.709 READ FPDMA QUEUED
60 02 00 00 88 00 00 01 c7 92 00 40 00 03:32:42.708 READ FPDMA QUEUED
SMART Extended Self-test Log Version: 1 (1 sectors)
Num Test_Description Status Remaining LifeTime(hours) LBA_of_first_error
# 1 Short offline Completed without error 00% 23547 —
# 2 Short offline Completed without error 00% 14098 —
SMART Selective self-test log data structure revision number 1
SPAN MIN_LBA MAX_LBA CURRENT_TEST_STATUS
1 0 0 Not_testing
2 0 0 Not_testing
3 0 0 Not_testing
4 0 0 Not_testing
5 0 0 Not_testing
Selective self-test flags (0x0):
After scanning selected spans, do NOT read-scan remainder of disk.
If Selective self-test is pending on power-up, resume after 0 minute delay.
SCT Status Version: 3
SCT Version (vendor specific): 258 (0x0102)
Device State: Active (0)
Current Temperature: 28 Celsius
Power Cycle Min/Max Temperature: 26/28 Celsius
Lifetime Min/Max Temperature: 26/69 Celsius
Under/Over Temperature Limit Count: 0/0
SCT Temperature History Version: 2
Temperature Sampling Period: 1 minute
Temperature Logging Interval: 1 minute
Min/Max recommended Temperature: 0/60 Celsius
Min/Max Temperature Limit: -41/85 Celsius
Temperature History Size (Index): 478 (162)
Index Estimated Time Temperature Celsius
163 2024-05-30 13:12 42 ***********************
164 2024-05-30 13:13 43 ************************
165 2024-05-30 13:14 43 ************************
166 2024-05-30 13:15 42 ***********************
… ..( 7 skipped). .. ***********************
174 2024-05-30 13:23 42 ***********************
175 2024-05-30 13:24 43 ************************
176 2024-05-30 13:25 43 ************************
177 2024-05-30 13:26 42 ***********************
… ..( 61 skipped). .. ***********************
239 2024-05-30 14:28 42 ***********************
240 2024-05-30 14:29 43 ************************
241 2024-05-30 14:30 43 ************************
242 2024-05-30 14:31 42 ***********************
… ..( 2 skipped). .. ***********************
245 2024-05-30 14:34 42 ***********************
246 2024-05-30 14:35 43 ************************
247 2024-05-30 14:36 43 ************************
248 2024-05-30 14:37 43 ************************
249 2024-05-30 14:38 42 ***********************
… ..( 5 skipped). .. ***********************
255 2024-05-30 14:44 42 ***********************
256 2024-05-30 14:45 43 ************************
257 2024-05-30 14:46 43 ************************
258 2024-05-30 14:47 43 ************************
259 2024-05-30 14:48 42 ***********************
… ..( 30 skipped). .. ***********************
290 2024-05-30 15:19 42 ***********************
291 2024-05-30 15:20 43 ************************
292 2024-05-30 15:21 43 ************************
293 2024-05-30 15:22 43 ************************
294 2024-05-30 15:23 42 ***********************
… ..( 26 skipped). .. ***********************
321 2024-05-30 15:50 42 ***********************
322 2024-05-30 15:51 43 ************************
323 2024-05-30 15:52 43 ************************
324 2024-05-30 15:53 42 ***********************
… ..( 29 skipped). .. ***********************
354 2024-05-30 16:23 42 ***********************
355 2024-05-30 16:24 43 ************************
356 2024-05-30 16:25 43 ************************
357 2024-05-30 16:26 42 ***********************
358 2024-05-30 16:27 42 ***********************
359 2024-05-30 16:28 42 ***********************
360 2024-05-30 16:29 43 ************************
361 2024-05-30 16:30 42 ***********************
… ..( 12 skipped). .. ***********************
374 2024-05-30 16:43 42 ***********************
375 2024-05-30 16:44 43 ************************
376 2024-05-30 16:45 43 ************************
377 2024-05-30 16:46 42 ***********************
… ..( 4 skipped). .. ***********************
382 2024-05-30 16:51 42 ***********************
383 2024-05-30 16:52 43 ************************
384 2024-05-30 16:53 42 ***********************
… ..( 4 skipped). .. ***********************
389 2024-05-30 16:58 42 ***********************
390 2024-05-30 16:59 43 ************************
391 2024-05-30 17:00 42 ***********************
392 2024-05-30 17:01 42 ***********************
393 2024-05-30 17:02 43 ************************
394 2024-05-30 17:03 42 ***********************
… ..( 53 skipped). .. ***********************
448 2024-05-30 17:57 42 ***********************
449 2024-05-30 17:58 43 ************************
450 2024-05-30 17:59 42 ***********************
… ..( 25 skipped). .. ***********************
476 2024-05-30 18:25 42 ***********************
477 2024-05-30 18:26 43 ************************
0 2024-05-30 18:27 42 ***********************
1 2024-05-30 18:28 42 ***********************
2 2024-05-30 18:29 ? —
3 2024-05-30 18:30 26 *******
… ..( 2 skipped). .. *******
6 2024-05-30 18:33 26 *******
7 2024-05-30 18:34 27 ********
8 2024-05-30 18:35 27 ********
9 2024-05-30 18:36 27 ********
10 2024-05-30 18:37 28 *********
11 2024-05-30 18:38 42 ***********************
12 2024-05-30 18:39 43 ************************
13 2024-05-30 18:40 42 ***********************
… ..( 8 skipped). .. ***********************
22 2024-05-30 18:49 42 ***********************
23 2024-05-30 18:50 43 ************************
24 2024-05-30 18:51 42 ***********************
… ..( 12 skipped). .. ***********************
37 2024-05-30 19:04 42 ***********************
38 2024-05-30 19:05 43 ************************
… ..( 6 skipped). .. ************************
45 2024-05-30 19:12 43 ************************
46 2024-05-30 19:13 42 ***********************
… ..( 7 skipped). .. ***********************
54 2024-05-30 19:21 42 ***********************
55 2024-05-30 19:22 43 ************************
… ..( 2 skipped). .. ************************
58 2024-05-30 19:25 43 ************************
59 2024-05-30 19:26 42 ***********************
60 2024-05-30 19:27 42 ***********************
61 2024-05-30 19:28 42 ***********************
62 2024-05-30 19:29 43 ************************
63 2024-05-30 19:30 42 ***********************
… ..( 10 skipped). .. ***********************
74 2024-05-30 19:41 42 ***********************
75 2024-05-30 19:42 43 ************************
76 2024-05-30 19:43 42 ***********************
… ..( 9 skipped). .. ***********************
86 2024-05-30 19:53 42 ***********************
87 2024-05-30 19:54 43 ************************
88 2024-05-30 19:55 43 ************************
89 2024-05-30 19:56 43 ************************
90 2024-05-30 19:57 42 ***********************
… ..( 4 skipped). .. ***********************
95 2024-05-30 20:02 42 ***********************
96 2024-05-30 20:03 43 ************************
97 2024-05-30 20:04 43 ************************
98 2024-05-30 20:05 42 ***********************
… ..( 5 skipped). .. ***********************
104 2024-05-30 20:11 42 ***********************
105 2024-05-30 20:12 43 ************************
… ..( 2 skipped). .. ************************
108 2024-05-30 20:15 43 ************************
109 2024-05-30 20:16 42 ***********************
… ..( 12 skipped). .. ***********************
122 2024-05-30 20:29 42 ***********************
123 2024-05-30 20:30 43 ************************
… ..( 5 skipped). .. ************************
129 2024-05-30 20:36 43 ************************
130 2024-05-30 20:37 42 ***********************
… ..( 7 skipped). .. ***********************
138 2024-05-30 20:45 42 ***********************
139 2024-05-30 20:46 43 ************************
… ..( 3 skipped). .. ************************
143 2024-05-30 20:50 43 ************************
144 2024-05-30 20:51 42 ***********************
145 2024-05-30 20:52 42 ***********************
146 2024-05-30 20:53 42 ***********************
147 2024-05-30 20:54 43 ************************
148 2024-05-30 20:55 42 ***********************
149 2024-05-30 20:56 42 ***********************
150 2024-05-30 20:57 42 ***********************
151 2024-05-30 20:58 43 ************************
152 2024-05-30 20:59 42 ***********************
153 2024-05-30 21:00 42 ***********************
154 2024-05-30 21:01 42 ***********************
155 2024-05-30 21:02 43 ************************
156 2024-05-30 21:03 43 ************************
157 2024-05-30 21:04 42 ***********************
… ..( 4 skipped). .. ***********************
162 2024-05-30 21:09 42 ***********************
SCT Error Recovery Control command not supported
Device Statistics (GP/SMART Log 0x04) not supported
SATA Phy Event Counters (GP Log 0x11)
ID Size Value Description
0x0001 2 0 Command failed due to ICRC error
0x0002 2 0 R_ERR response for data FIS
0x0003 2 0 R_ERR response for device-to-host data FIS
0x0004 2 0 R_ERR response for host-to-device data FIS
0x0005 2 0 R_ERR response for non-data FIS
0x0006 2 0 R_ERR response for device-to-host non-data FIS
0x0007 2 0 R_ERR response for host-to-device non-data FIS
0x000a 2 2 Device-to-host register FISes sent due to a COMRESET
0x000b 2 0 CRC errors within host-to-device FIS
0x8000 4 483 Vendor specific